Results from the Department for Transport-funded Propensity to Cycle Tool project – February 2017
Data produced for a Department for Transport funded tool highlights just how much more cycling people in England could do, given the right policies and investments. New analysis for the Propensity to Cycle Tool – www.pct.bike – shows that if English people were as likely as the Dutch to cycle trips of similar length and hilliness, nearly one in five of us would cycle to work.
Jump to: What is cycling potential? – The four scenarios – If England went Dutch – Electric boost – Where has the highest commuter cycling potential? – The streets of London – Rural potential – Benefits of increased cycling levels – Implications for Policy – References
The data in this briefing comes from the Propensity to Cycle Tool, although not directly from the interface, which operates at Middle-Layer Super Output Area (MSOA) level.
- Map of current and potential cycle commuting by local authority district, including for each scenario health and carbon benefits compared to 2011 census figures: www.pct.bike/la-map.html
- Data table at local authority level, including changes in cycling levels, other modes of transport, and health and carbon benefits: www.pct.bike/laresults.csv
- The variable codebook is available at www.pct.bike/lacodebook.csv
Update 13/04/2017: Interactive map of current and potential cycle commuting by local authority district, including for each scenario health and carbon benefits compared to 2011 Census figures. www.pct.bike/la-map.html
What is cycling potential?
Cycling potential is the level of cycling that can be expected under different potential future scenarios. The Propensity to Cycle Tool currently uses 2011 Census data about main mode journeys to work, and looks at which of these journeys could most easily be switched to cycling.
The results show that with the right cycling conditions, cycling levels across the country could be much higher than they currently are. Our calculation of cycling potential is based on journey distances and how hilly routes are – important factors determining the ‘cyclability’ of trips.
In England only one in thirty commuters (3%) cycle all the way to work. Sometimes people assume that this is because England is too hilly or journey distances are too long. However, while our results show that while hilliness and distance do play an important role in influencing cycling levels, these factors are not everything. Some hilly places, such as Bristol, have achieved higher than average cycling despite having a modelled cycling propensity below the national average.
The four scenarios
Four scenarios of change were developed to help planners understand which areas and routes have the highest potential for cycling under different sets of assumptions:
- Government Target, which assumes that cycling levels double nationally, and uses trip distance and hilliness to
predict which trips would switch. - Gender Equality, in which women have the same propensity to cycle a given trip as men.
- Go Dutch draws on Dutch Travel Survey data to estimate what cycling levels one would observe if England acquired Dutch cycling infrastructure and Dutch cycling culture, but kept its current trip distances and hilliness.
- Ebikes takes Go Dutch even further, and uses additional data on how ebike ownership encourages longer trips and overcomes hilliness.
If England went Dutch
Just how much the English could cycle was tested in the Propensity to Cycle Tool using the Go Dutch scenario. This applies Dutch cycling rates to commute trips in England, adjusted for distance and hilliness. (While England is hillier than the Netherlands, our commutes tend to be shorter). This scenario showed that if English people became as likely to cycle as Dutch people, nearly one in five (18%) would cycle to work – almost a 6-fold increase.
Across England, every local authority would see at least one in fifteen commuters cycling to work, with a third seeing cycle commuting rates of one in five (20%) or more, even accounting for England’s hills and average trip distances.
Electric boost
The Ebikes scenario builds on the Go Dutch scenario and looks at the additional cycling potential if people had Dutch propensity plus widespread access to electric bikes (‘ebikes’).
Ebikes enable people to cycle that bit further and tackle hills more easily. In Germany, half a million ebikes are sold every year, helping a hilly country reach high levels of cycling. Ebikes are likely to be particularly important for increasing cycling among older adults.
Under the Ebikes scenario, more than one in four commuters (26%) would cycle all the way to work. Even in very hilly areas like West Devon, at least one in seven commuters might cycle.
Fig.1: Cycle commuting by local authority, Census 2011, Go Dutch and Ebikes scenarios
Where has the highest commuter cycling potential?
Kingston upon Hull has the highest cycling potential of any local authority in the Ebikes scenario, and the second highest in Go Dutch. Hull already has relatively high cycling rates for the UK, with almost one in ten commuters (9%) travelling by bike. But if people living in Hull had the same willingness to cycle a given distance and hilliness as people living in the Netherlands, nearly two in every five of all commuters (37%) would cycle. This would take around 17,000 cars off Hull’s roads every morning.
Under the Go Dutch scenario, no local authority has a predicted cycle commute mode share of less than 6%. Under the Ebikes scenario none is less than 15%.
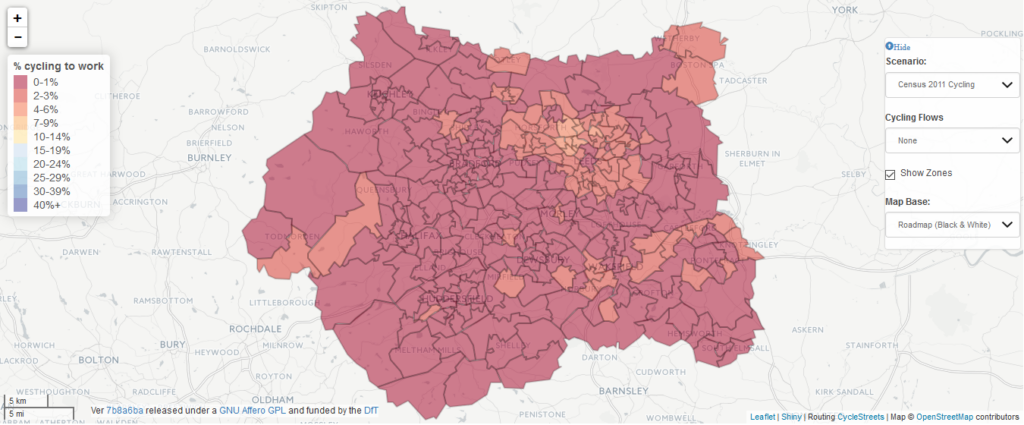
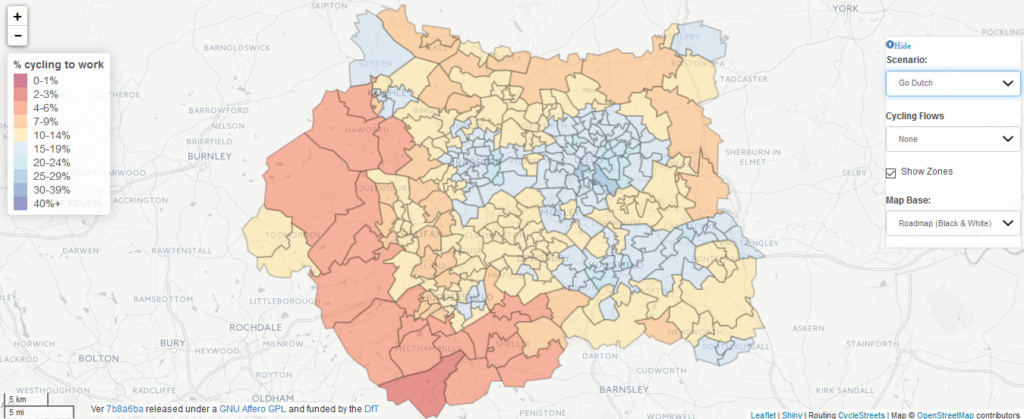
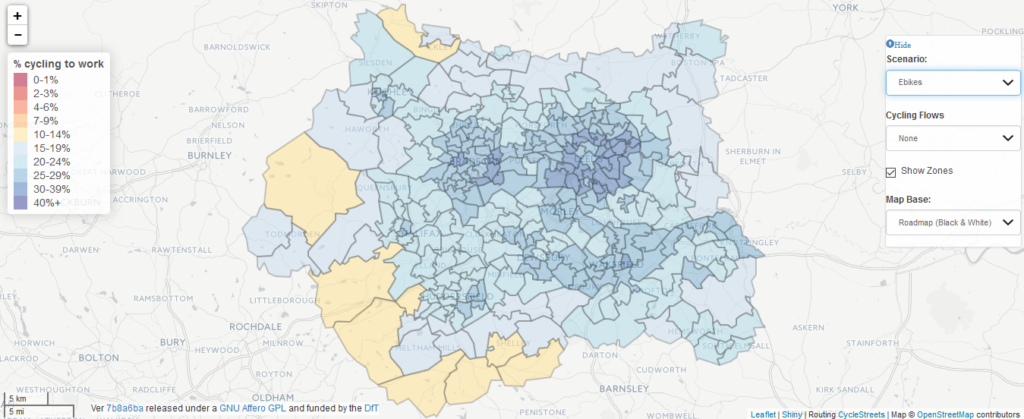
Even Cambridge, the local authority with by far the highest current cycling rate in England (32%, nearly one in three commuters), could have still higher cycling levels in the Go Dutch (38%) and Ebikes (40%) scenarios. This shows that any local authority in England that wishes to promote active travel can consider itself to have considerable potential for cycling growth. For example, cycle commuting levels in hilly Leeds are currently only 2%. In the Go Dutch scenario it is 16%, jumping up to 26% when we add in ebikes.
Fig.2: Cycle commuting for different scenarios across West Yorkshire
1. Census 2011
2. Go Dutch
3. Ebikes
The streets of London
In the Go Dutch scenario, three of the top 10 authorities for cycling potential are in Inner London: Westminster, Tower Hamlets and Hackney. All see cycle commuting rates of around 30% in the Go Dutch scenario, and nearer 40% with ebikes added in.
Even Hackney, where 15% of people already ride to work, has substantial unrealised potential. In Westminster, cycling levels could be seven times their current level of 5%. This could relieve pressure on Central London’s road and public transport systems and help improve air quality.
Large increases are possible in Outer London too. Waltham Forest, home to one of Transport for London’s new ‘mini-Holland’ schemes, currently sees only 3% of commuters cycling to work. But the Go Dutch scenario shows 18% and the Ebikes scenario shows 26% cycle commuting potential.
It is important to note that in many authorities, as in Outer London boroughs, there is additional potential for combining public transport and cycling for longer commute trips. This is not included in the current version of the tool.
Rural potential
Cycling is often seen only as something with potential to grow in towns and cities. However, hilly rural areas could also see much more cycling than at present with the right policies.
In Cornwall, only one in fifty commuters currently cycle to work. The Go Dutch scenario shows one in ten commuters cycling, rising to one in five when we assume ebikes are available for longer or hillier trips.
Benefits of increased cycling levels
The Propensity to Cycle Tool allows people to explore health benefits and reductions in CO2 emissions that might be generated by growth in cycling under the different scenarios. Some of these benefits come directly from cycling, while others would come from people not using a car.
Health boost
We used a modified version of the World Health Organization’s Health Economic Assessment Tool (HEAT), using locally specific information, to calculate the economic benefits of the improved health that increases in cycling could bring.
Research shows that growth in cycling benefits health, mainly through the extra physical activity that many new cyclists get. The health benefit any individual gets depends on their age and gender, which mode the switched trip comes from, and on the length and hilliness of the newly cycled trip. From this health gain we can then calculate an economic benefit to society.
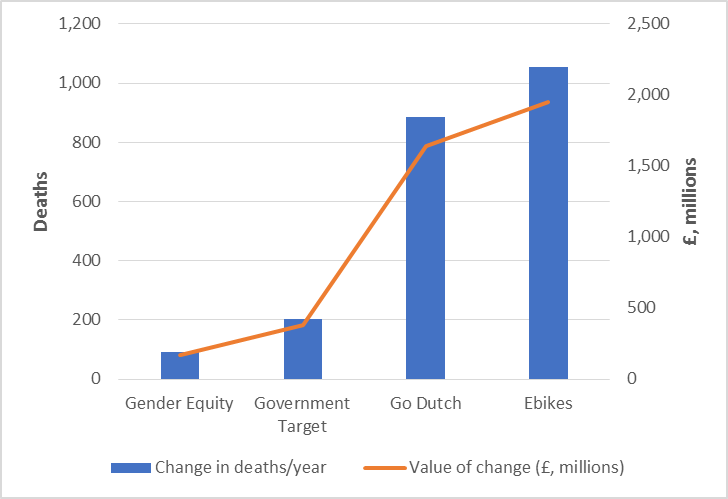
Under the Go Dutch scenario, English local authorities could see an average health economic benefit of £5 million per authority.
If we compare local authorities, then not surprisingly the biggest come top: Birmingham, the largest local authority, also sees the largest total health benefits. Under Go Dutch, around 27 premature deaths would be averted each year in Birmingham compared to current levels of commuter cycling – an annual economic benefit of nearly £50 million. Looking at health benefits per commuter, Middlesbrough sees the largest estimated health gain.
Fig.3: Premature deaths averted per year, and the value of this change in million pounds, for each scenario compared to current cycling – totals for England
Cutting carbon
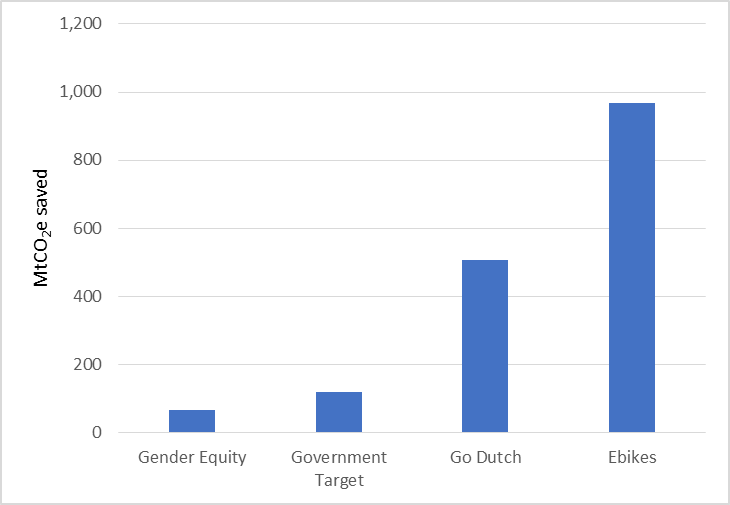
CO2 savings are calculated based on the number of car trips that would be replaced by cycling, and how long they are. The number of car-driving commuters changing to cycling varies by scenario: the Government Target scenario has almost 400,000 fewer drivers, Go Dutch has around 2 million fewer, and Ebikes has around 3 million fewer. How do we know where people would switch from?
We assume that for each trip, new cyclists will come proportionally from the other methods of transport currently being used. So for instance, if most people are currently driving a trip, most new cyclists are likely to come from the car. But if most people are currently walking a trip, that’s where most new cyclists are likely to come from.
Using the Go Dutch scenario, English local authorities could reduce outputs of CO2 by over 1500 tonnes per year on average. The biggest reduction per commuter is in Spelthorne, in Surrey.
Figure 4. The total carbon reduction benefits for England for each scenario, compared to current cycling levels
Implications for policy
- With the right infrastructure and policy, there is substantial potential for cycling across English local authorities.
- While all areas could see large health benefits and CO2 savings, these vary by area: more car dependent areas will see the biggest CO2 savings per person.
- In hillier and more rural areas, achieving high cycling levels may involve much greater use of ebikes as well as improving cycling conditions.
- As well as showing the national-level potential, the tool can help planners identify areas and routes within local areas for priority investment.
References and resources
- Access the Propensity to Cycle Tool at www.pct.bike
- Contact pct@pct.bike
- Download a brochure introducing the PCT.
- Download the local authority data table at www.pct.bike/laresults.csv and the variable codebook at www.pct.bike/lacodebook.csv
- How much could commuter cycling increase in your part of England? Guardian Bike Blog 13 April 2017 www.theguardian.com/environment/bike-blog/2017/apr/13/how-much-could-commuter-cycling-increase-in-your-part-of-england
- Lovelace, R., Goodman, A., Aldred, R., Berkoff, N., Abbas, A., Woodcock, J., 2016. The Propensity to Cycle Tool: An open source online system for sustainable transport planning. Journal of Transport and Land Use 10. doi:10.5198/jtlu.2016.862 www.jtlu.org/index.php/jtlu/article/view/862
- Aldred, R., Elliott, B., Woodcock, J. and Goodman, A. 2017. Cycling provision separated from motor traffic: a systematic review exploring whether stated preferences vary by gender and age. Transport Reviews 37 (1), 29-55 https://dx.doi.org/10.1080/01441647.2016.1200156
- Department for Transport. 2016. National propensity to cycle: first phase development study www.gov.uk/government/publications/national-propensity-to-cycle-first-phase-development-study
Institutions supporting the PCT team
- University of Cambridge: www.cam.ac.uk
- UKCRC Centre for Diet and Activity Research (CEDAR) www.cedar.iph.cam.ac.uk
- University of Leeds www.leeds.ac.uk
- University of Westminster, London www.westminster.ac.uk
The PCT is funded by the Department for Transport with additional impact funding secured from the Economic and Social Research Council and Engineering and Physical Science Research Council. This report represents the views of the PCT team and not necessarily those of the funders.
Please cite this Evidence Brief as: UKCRC Centre for Diet and Activity Research (CEDAR), Evidence Brief special (14) – England’s Cycling Potential – Results from the Department for Transport-funded Propensity to Cycle Tool project, February 2017. www.mrc-epid.cam.ac.uk/resources/policy-resources/evidence-briefs/eb-special-englands-cycling-potential

 MRC Epidemiology Unit